I’ve been tracking my outdoor activities using the Polar Grit X sports watch for quite a while now. After treading the same old paths over and over, I tried to think of ways how to mix things up a bit and maybe discover nearby areas I’ve missed. I figured a heatmap of the tracks might be useful for this purpose.
The Polar Flow Web Service can give you summaries and reports of your training sessions, and you can view them individually on a map, and that’s it. The service wouldn’t help with my particular use case, so I concluded I need to build the map myself using the stored GPS data, and some Python code.
Obtaining GPS Data
Trying to use the Polar Accesslink API to get the data would require filling forms with detailed personal info, and a reason for the access. That’s fair, but a bit of too much of an ask at this point.
However, thanks to GDPR, I own my own data, so there’s a convenient Download Everything button in the Polar account settings. Unsurprisingly, the downloaded file contains all of the GPS session records synced to the service in JSON format.
Creating the heatmap
After unpacking the resources, the next step was writing the Python script to process the buckets of coordinate data and chucking it to Folium 1. Some of the rendering settings like point blur and radius required fine-tuning to get acceptable results. Running the script resulted in a local HTML file that can be opened directly in your browser to examine the result.
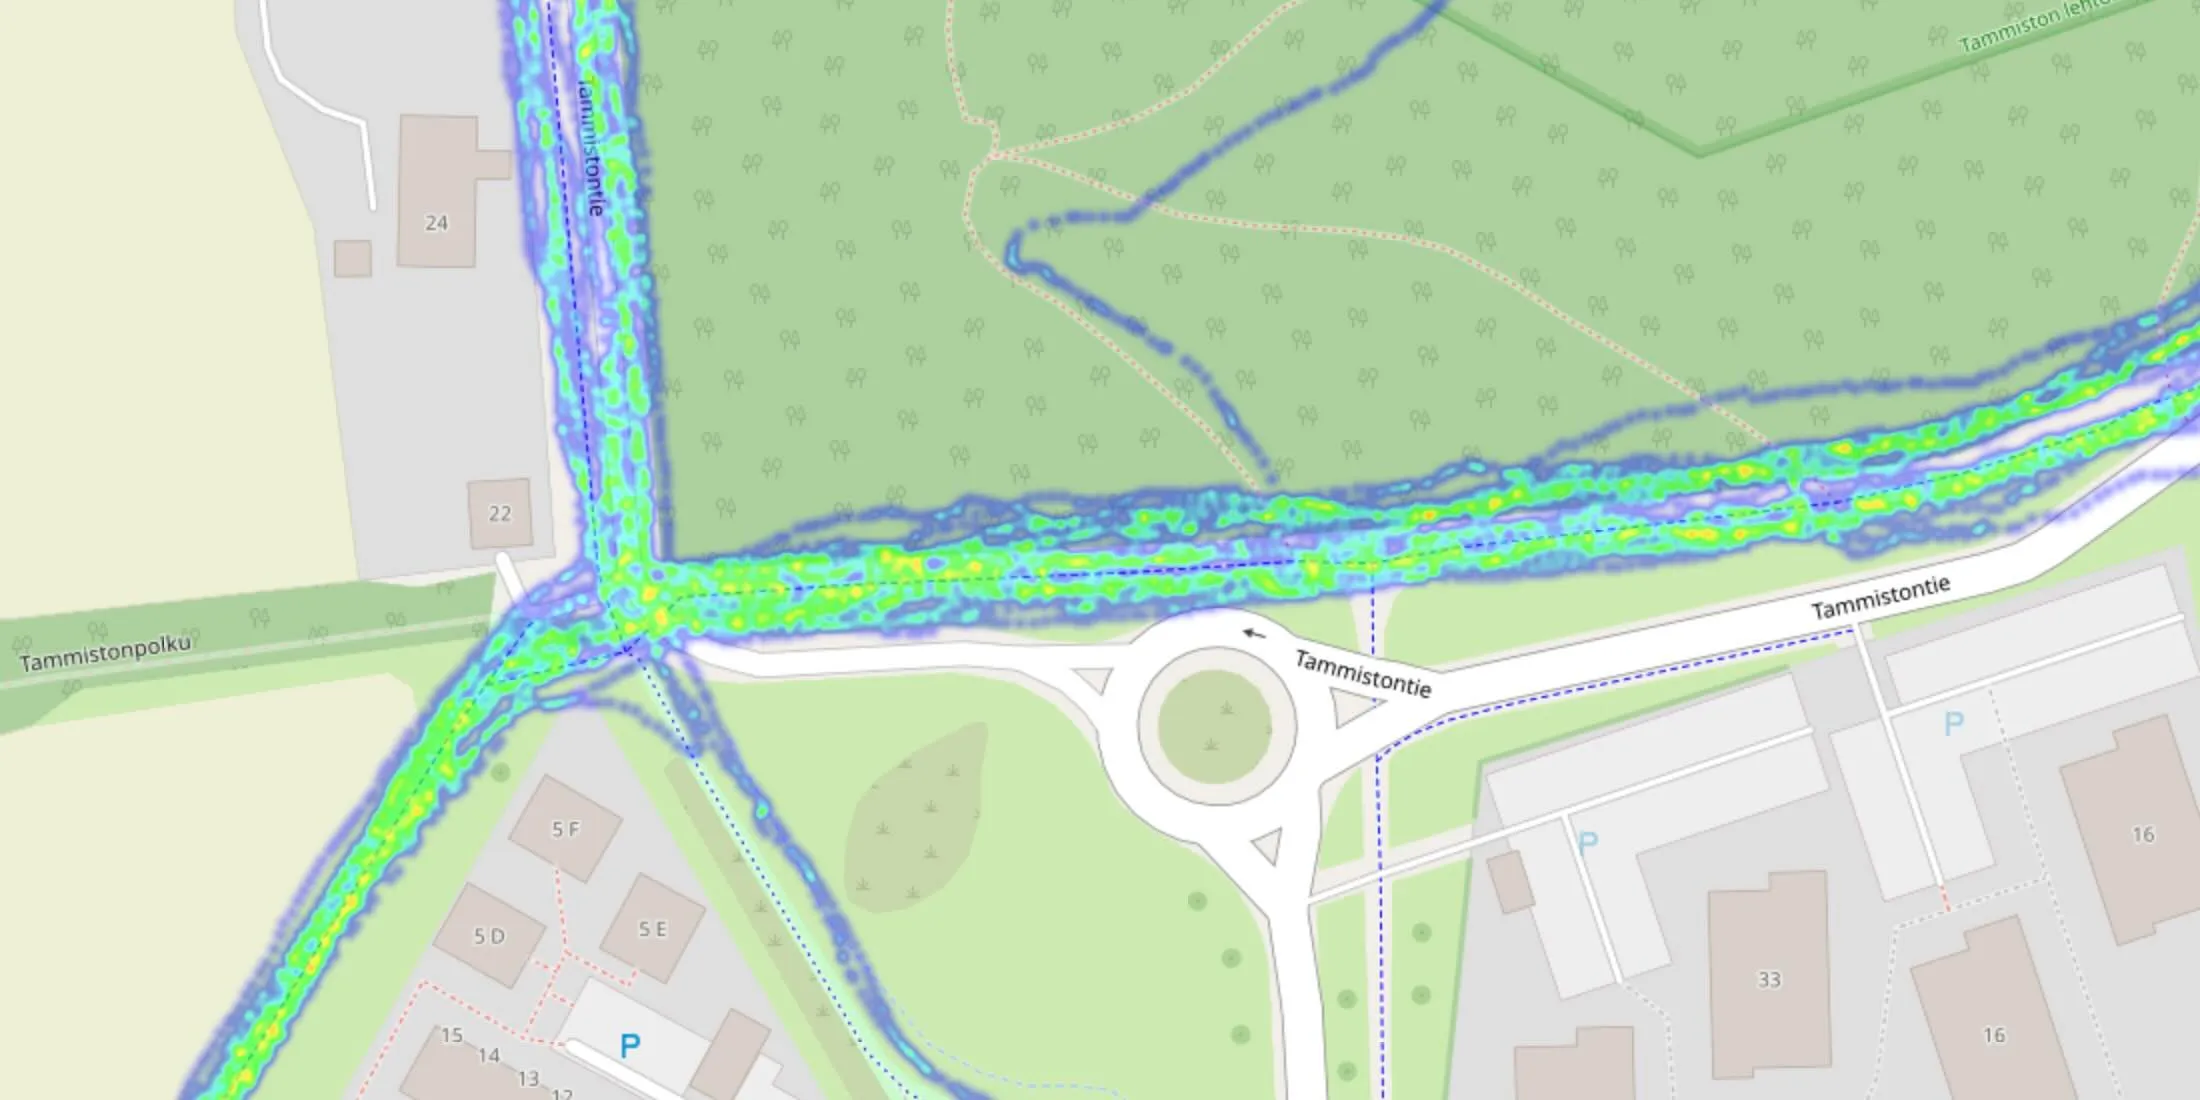 A sample of the generated HTML page displaying OpenStreetMap overlaid with the heatmap
My map had roughly 4.3 million coordinate points within an area of 20 km squared, so it’s a bit sluggish but manageable on an M1 MacBook Air. It took roughly 10 seconds to generate the HTML page.
Conclusion
The map fit well to my needs, and it wasn’t too difficult to build. Updating the map frequently using this method seems a bit of a hassle, and I’m not sure it’s worth the effort to try to make it more user friendly. Nevertheless, I decided to document the process and put it out there in case someone might find something of value in it.
Build steps
Download and prepare the data:
- Login to account.polar.com and download your data.
- On your computer, create a directory like
heatmap/where you unzip the downloaded file there. - Rename the unzipped directory with JSON files to
data/.
Set up and run the script:
- In the created directory, create a file
heatmap.py, copy contents below. - Make sure
folium1 can be imported, runpip install folium. - Run the script:
python heatmap.py. Some of the files may be ignored, which is expected.
The script creates heatmap.html in the directory, which can be opened in a browser (eg. doubleclick the file or run open heatmap.html.) If there are problems opening the map, try with different browsers.
Files
For troubleshooting, the files after running the script are listed below.
/heatmap/data/training-session-...1.json  # JSON files with GPS data
/heatmap/data/training-session-...2.json
/heatmap/data/training-session-...n.json
/heatmap/heatmap.py                       # The script
/heatmap/heatmap.html                     # Generated result
# File: heatmap.py

# Writes a file "heatmap.html", and simply open it in a browser to view the result

import folium
import folium.plugins as plugins
import json
import os
import time
from multiprocessing import Pool

start_time = time.time()

# The directory containing the JSON files
dir_path = 'data'

def read_file(filename):
  with open(os.path.join(dir_path, filename)) as json_file:
    data = json.load(json_file)
  try:
    coords = []
    for route in data['exercises'][0]['samples']['recordedRoute']:
      coords.append([route['latitude'], route['longitude']])
    return coords
  except (KeyError, TypeError):
    print("Ignoring file", json_file.name)
    return False

if __name__ == '__main__':
  ignored_files = 0
  points = []
  files = []
  for filename in os.listdir(dir_path):
    if filename.endswith('.json'):
      files.append(filename)

  # Use a process pool to read the files in parallel
  with Pool() as pool:
    coords = pool.map(read_file, files)
    for elem in coords:
      if elem:
        for el in elem:
          points.append(el)
      else:
        ignored_files += 1

  # Center map on the average latitude and longitude of the data
  center_lat = sum(point[0] for point in points) / len(points)
  center_lon = sum(point[1] for point in points) / len(points)

  print("Creating heatmap using {} coordinate points centered at {:.6f} {:.6f}".format(
    len(points), center_lat, center_lon))

  m = folium.Map(location=[center_lat, center_lon], zoom_start=10)
  heat_map = plugins.HeatMap(points, blur=3, radius=3)
  m.add_child(heat_map)
  m.save('heatmap.html')

  end_time = time.time()
  print("Processing took {:.2f} seconds".format(end_time - start_time))
  print("Ignored files:", ignored_files)
The script expects to find the following JSON structure. If it can’t, the file is ignored.
{
  "exportVersion": "1.6",
  ...
  "exercises": [
    {
      "startTime": "2020-08-09T19:44:29.296",
      ...
       "samples": {
        "recordedRoute": [
          {
            "dateTime": "2020-08-09T19:44:51.387",
            "longitude": 25.00000,
            "latitude": 60.00000,
            "altitude": 100.0
          },
          {
            "dateTime": "2020-08-09T19:44:52.386",
            "longitude": 25.00000,
            "latitude": 60.00000,
            "altitude": 100.0
          },
          {
            "dateTime": "2020-08-09T19:44:53.386",
            "longitude": 25.00000,
            "latitude": 60.00000,
            "altitude": 100.0
          },
          ...