Debug Raspberry Pi Pico C/C++ SDK with Debug Probe
A description of a minimal setup needed to debug Pico projects in VSCode on macOS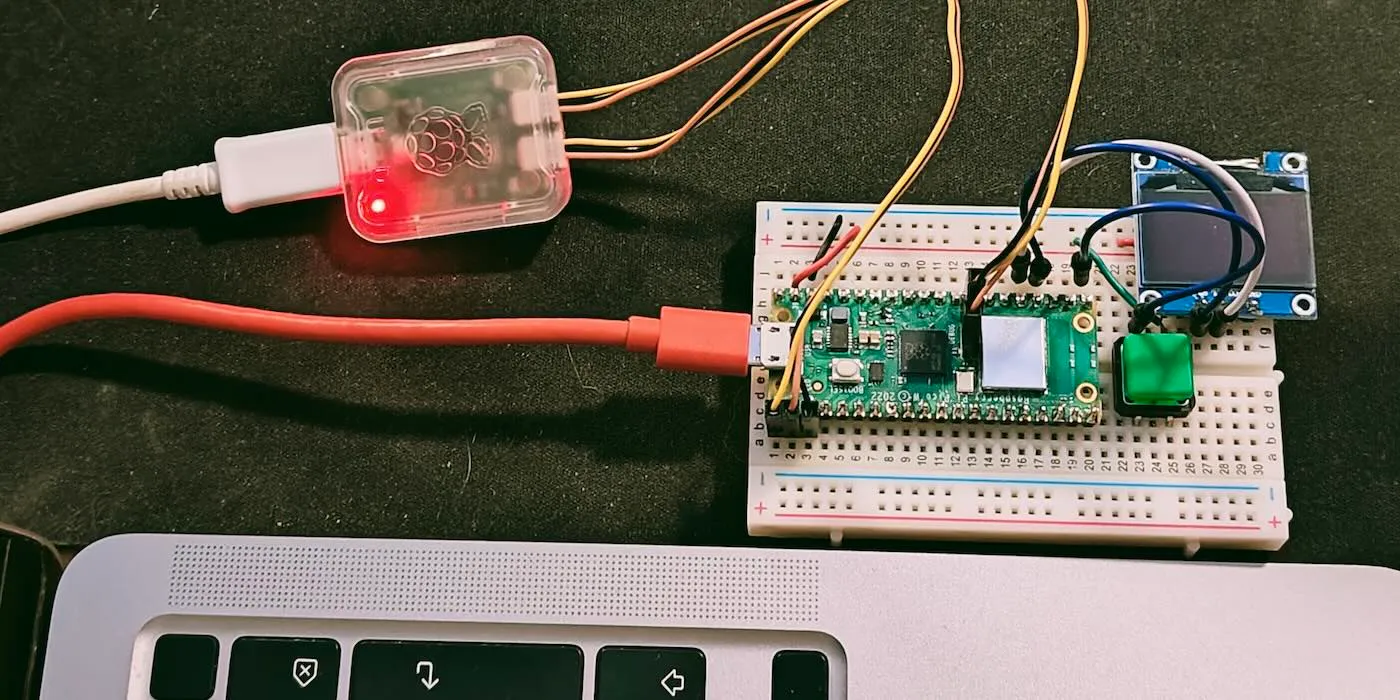
Working on C/C++ SDK Pico projects can be tedious if you’re doing manual copying and restarting after every build to see the result. Setting up an environment that allows deployments via the Serial Wire Debug (SWD) port will make the experience considerably better, so it’s a solid investment of your time.
If you try to look up information regarding Raspberry Pi Pico debugging, you may find quite a few sources with differing viewpoints what you need to do. Some of them contain outdated information that could just lead you to waste your time.
The instructions laid out here mostly describe my own setup with a minimal amount of steps to get the debugger up and running from scratch. If yours is different, you still may find some helpful clues in here.
The setup used in this article:
- macOS with
brew - The Raspberry Pi Pico Debug Probe
- Visual Studio Code (VSCode) and its extensions
- OpenOCD
Set up the tools
If you have some of the resources already on your system, check that you’re on the latest versions.
The C/C++ SDK
Fetch and initialize the SDK:
git clone https://github.com/raspberrypi/pico-sdk.git
cd pico-sdk
git submodule update --init
Make sure you have the PICO_SDK_PATH environment variable properly set.
The building and debugging tools
Unless you have them already, you may have to install Xcode CLI tools on your Mac before running the brew commands.
xcode-select --install
Install the build tools and the GNU ARM toolchain.
brew install cmake gcc-arm-embedded
For the debug probe you can use either a second Pico, or a Raspberry Pi Debug Probe. You’ll find instructions how to wire the devices in the official guide 1.
Install OpenOCD, and the debugger.
brew install openocd gdb
VSCode configuration
Make sure you have your project folder opened in VSCode. Then, do the following steps to finish up the setup.
Add extensions
For VSCode you’ll want to install Cortex-Debug, CMake Tools, and C/C++ for Visual Studio Code. Find them in your VSCode extension Marketplace, or run these commands:
code --install-extension marus25.cortex-debug
code --install-extension ms-vscode.cmake-tools
code --install-extension ms-vscode.cpptools
The official docs recommend installing minicom to use the UART connection. However, you can also use Serial Monitor VSCode extension by Microsoft.
code --install-extension ms-vscode.vscode-serial-monitor
Select the ARM kit
Select CMake in the Activity Bar, found on the left side of the IDE by default. Select Configure kit where it says “No Kit Selected”. You should see a list of kits, of which you should pick GCC 13.2.1 arm-none-eabi. You can try selecting “Scan for kits” if you can’t see the ARM kit.
Create config files
To configure the debugger, put the following in the config file .vscode/launch.json:
{
  "version": "0.2.0",
  "configurations": [
    {
      "showDevDebugOutput": "raw",
      "name": "My Pico Project Debug",
      "device": "RP2040",
      "cwd": "${workspaceRoot}",
      "executable": "${command:cmake.launchTargetPath}",
      "request": "launch",
      "type": "cortex-debug",
      "servertype": "openocd",
      "configFiles": [
        "/interface/cmsis-dap.cfg",
        "/target/rp2040.cfg"
      ],
      "searchDir": [
        "${workspaceRoot}"
      ],
      "openOCDPreConfigLaunchCommands": [
        "set USE_CORE 0",
        "adapter speed 5000"
      ],
      "svdFile": "${env:PICO_SDK_PATH}/src/rp2040/hardware_regs/rp2040.svd",
      "runToEntryPoint": "main",
      "postRestartCommands": [
        "break main",
        "continue"
      ]
    }
  ]
}
Make sure you have "set USE_CORE 0" in your "openOCDPreConfigLaunchCommands": [...].
Finally, put .vscode/settings.json in place, you can use a copy of the official example: https://github.com/raspberrypi/pico-examples/blob/master/ide/vscode/settings.json
Start a debugging session
Make sure you’ve got the project wired up for debugging. Again, see the official guide for help 1.
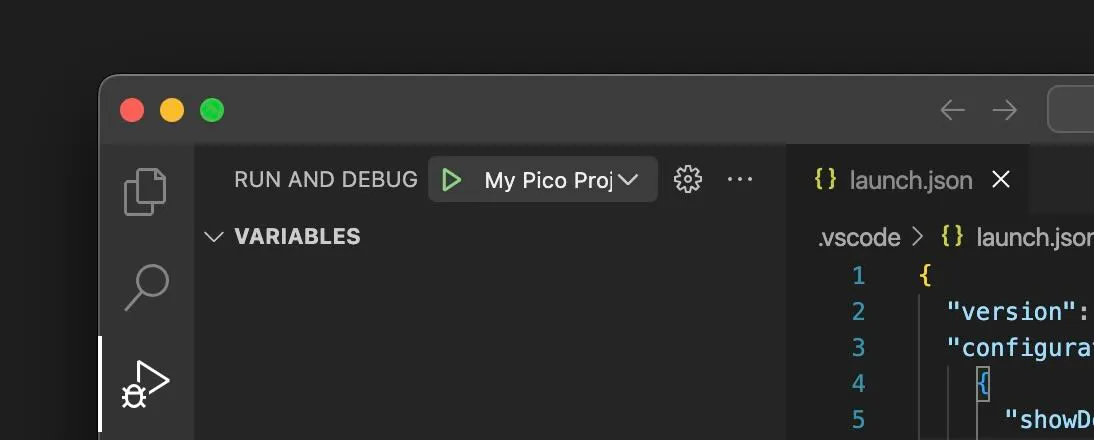
Select Run and Debug, and select the green play-button on top next to the debug configuration’s name. The session should now start, and then pause at the beginning of your main function as stated by the configuration in launch.json.
You can now place breakpoints on lines, and examine variables etc. as you would expect. When you change the sources, stop the session and hit play again – the resources will build, and a new session begins without touching the wires or the devices.